This is a follow-up on two previous entries that discuss the fixed indexed annuity study from Wharton Professor David Babbel.
The previous and related posts can be found here and here. Proper attribution, disclaimers and context for the study are discussed in these previous posts. It is worth noting again that the study and its slides are not intended to be used with any sales presentations.
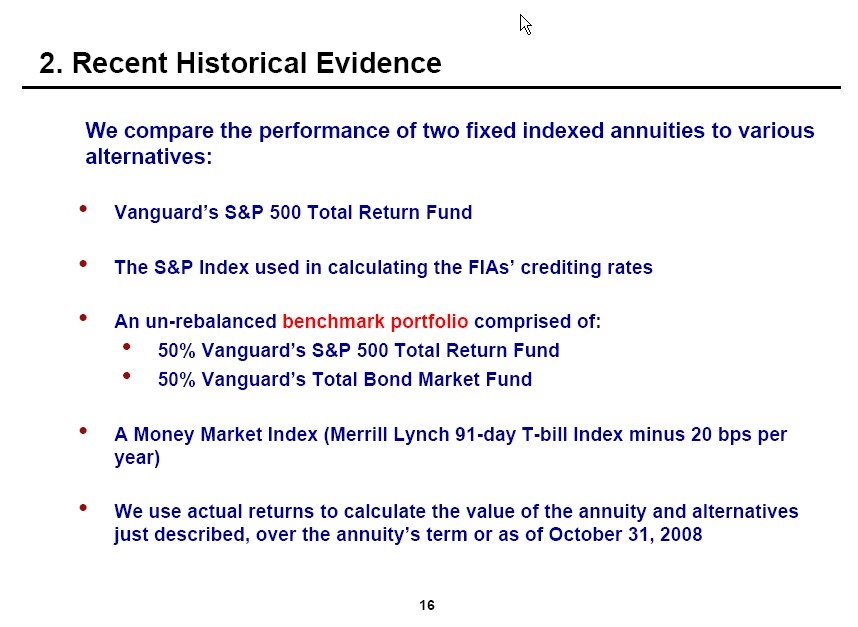
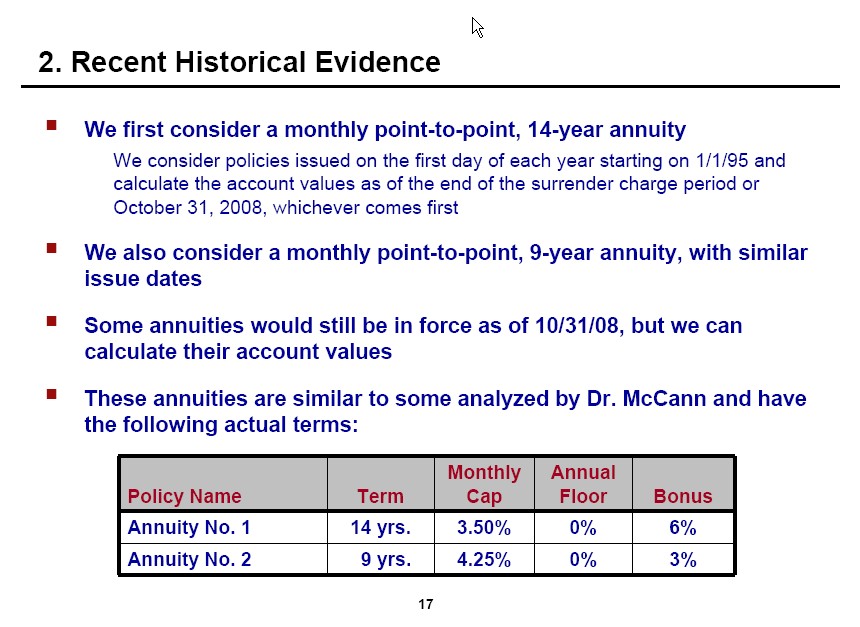
This first set of slides looks at the performance of two fixed indexed annuities compared to a portfolio of stocks and bonds since 1995. Some context and assumptions are as follows:
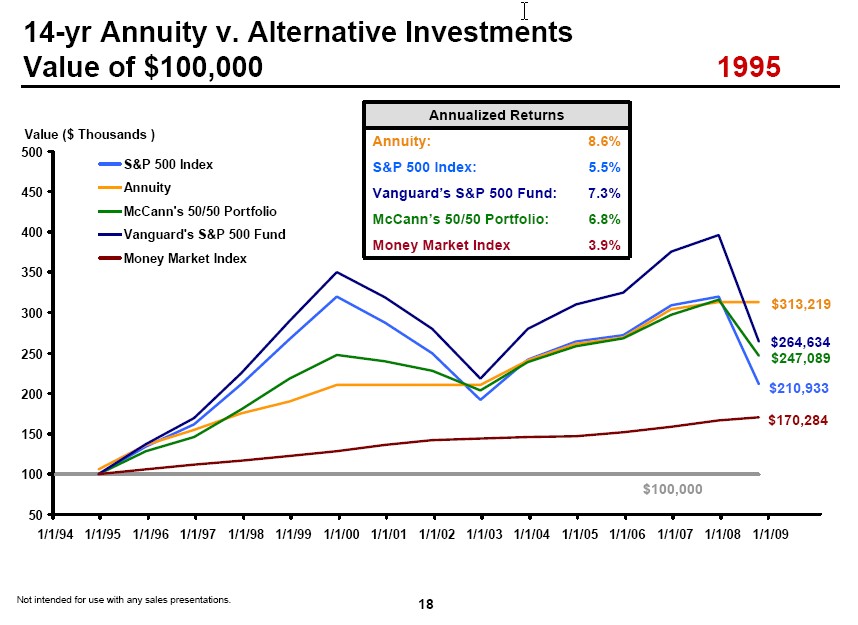
The first set of slides looks at the performance of the 14 year annuity. Results begin in 1995 and can be seen in this slide for the full period ending in 2007:
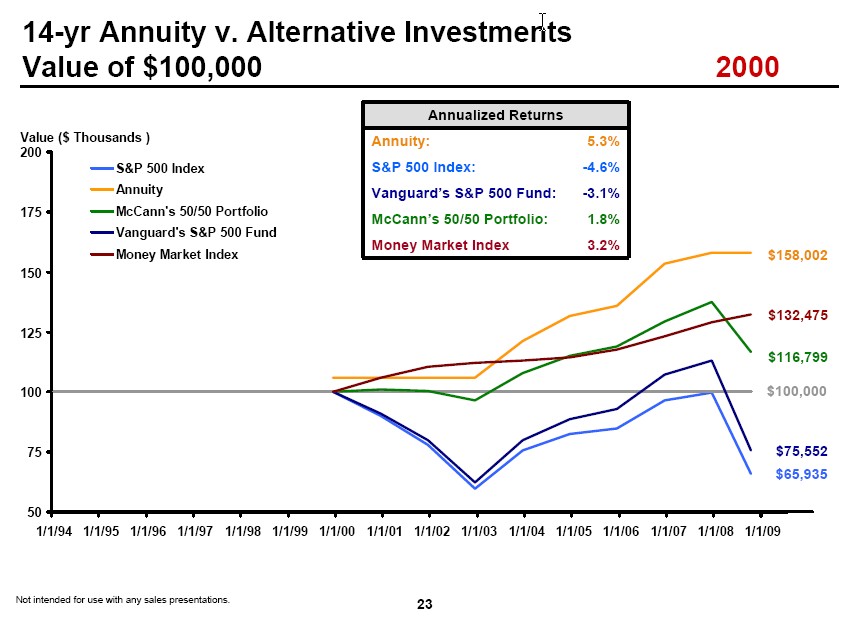
Looking at specific years as start dates can highlight the dramatic impact that sequence of returns risk can have on results. For example, consider the comparative performance of the annuity if the starting year is 2000 which--in retrospect of course--represents the height of the NASDAQ bubble:
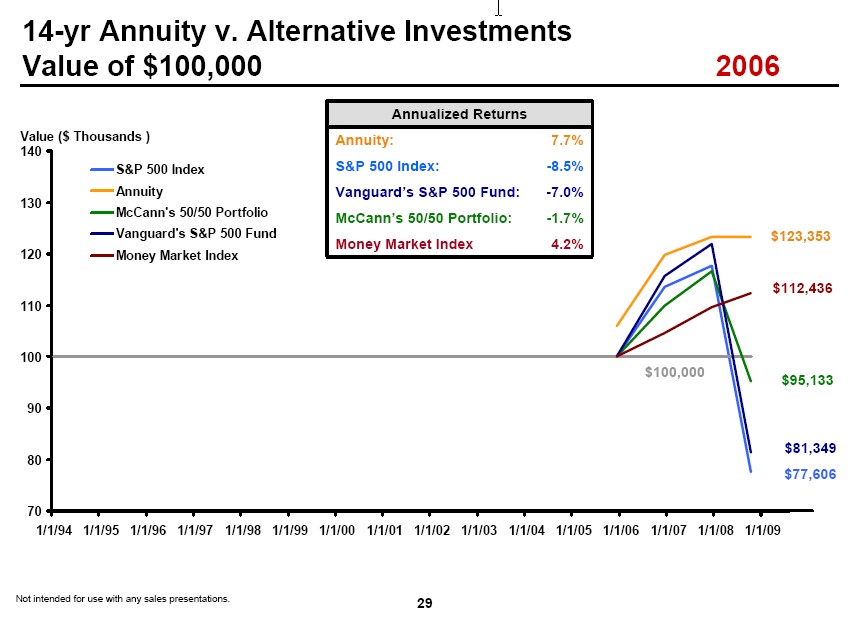
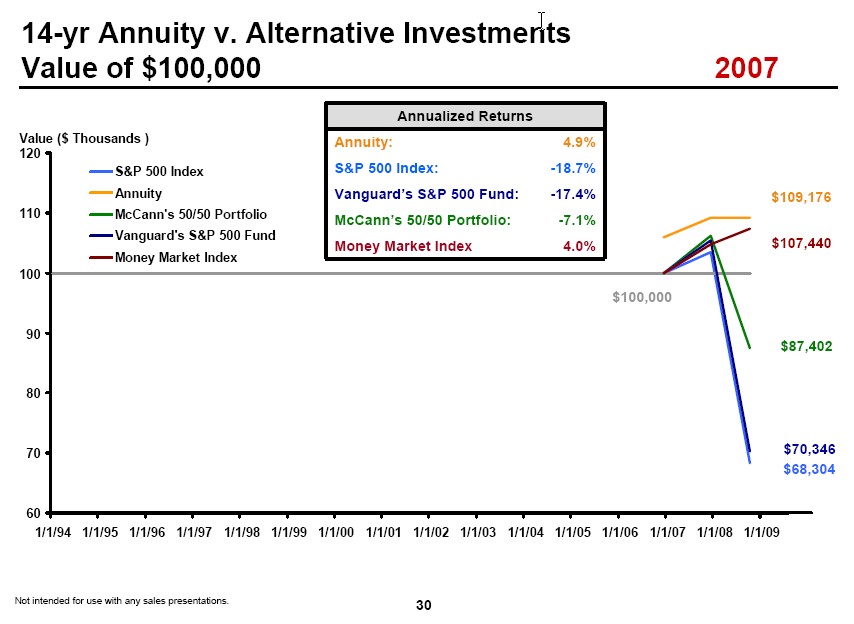
Similarly, consider the performance disparity if the start dates are at the height of the liquidity/real estate bubble in either 2006 or 2007:
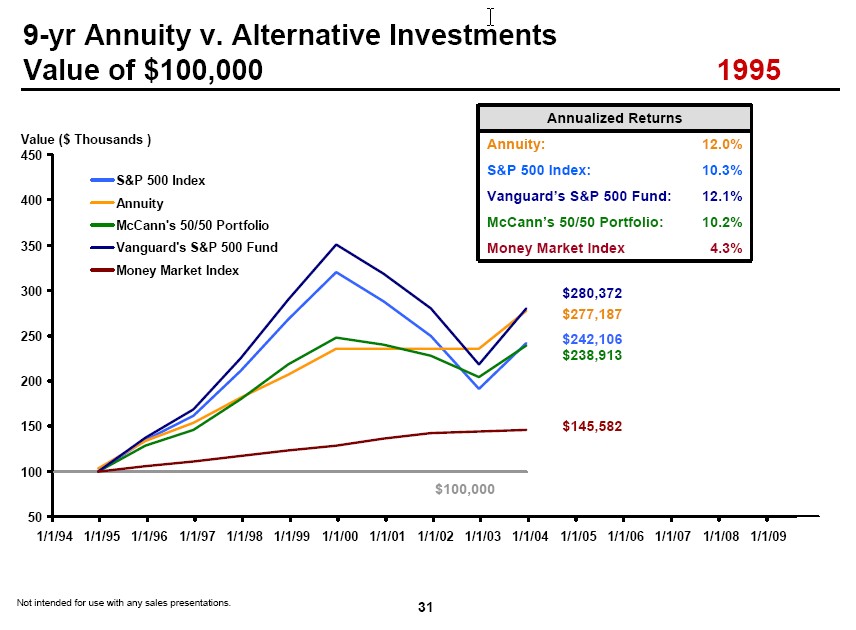
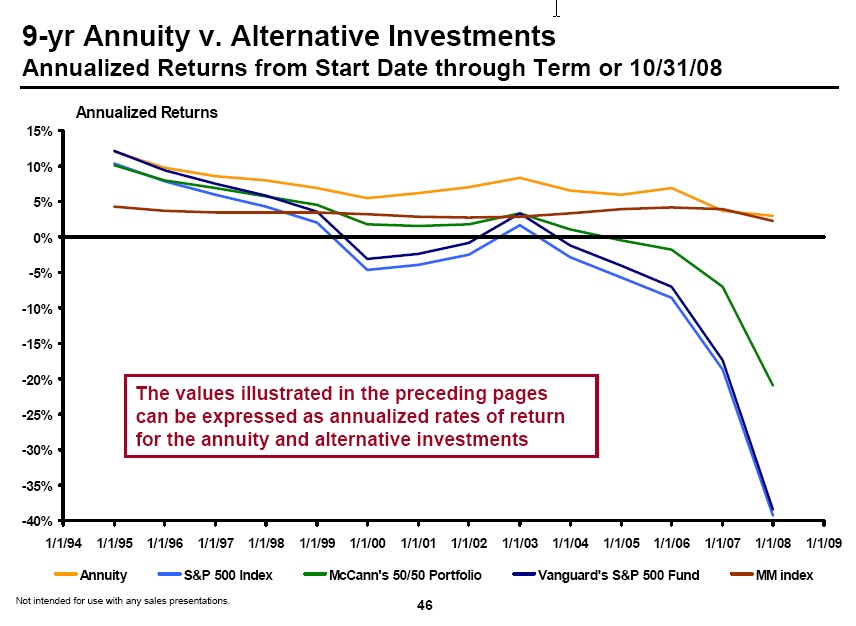
Next, results for the 9 year annuity are similar, although not quite as dramatic since they do not carry through the market implosion beginning in 2008:
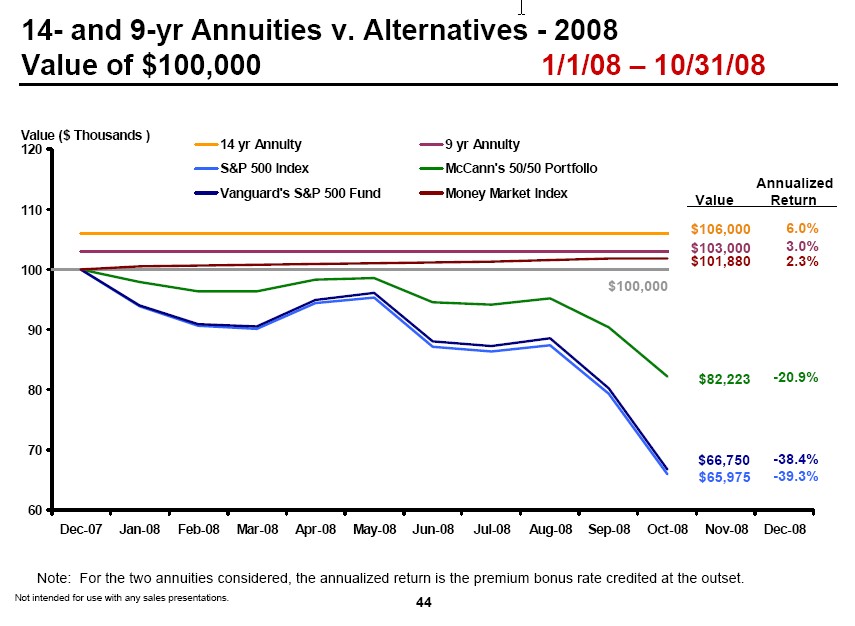
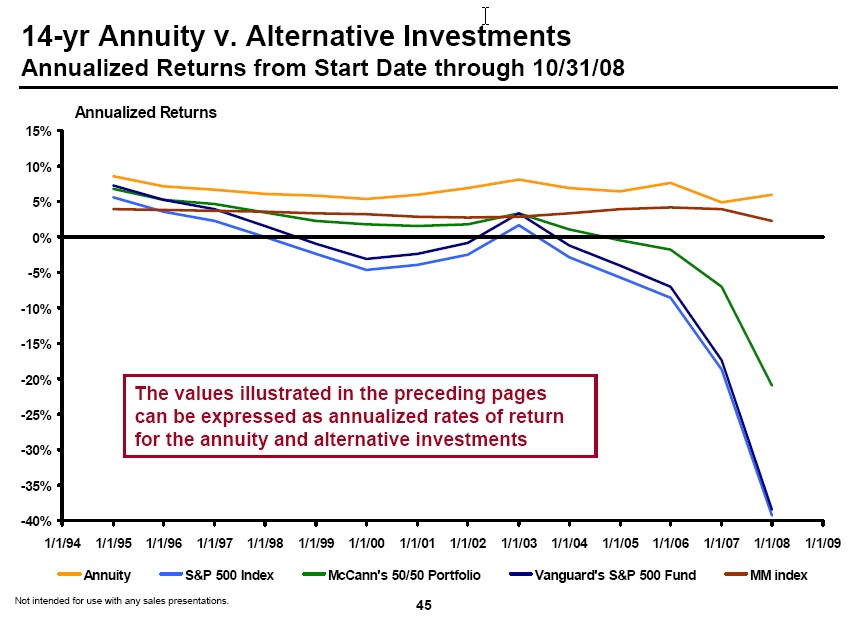
Last, the next 3 slides look at a comparison of the annualized return of each of the three options: the 14 year annuity, the 9 year annuity, and each of the investment alternatives. For the fixed indexed annuities, the annualized return is the premium bonus rate credited at the outset.
As seen in the following slide (which provides what is probably the most dramatic example of the effects of sequence of returns risk), there is more than a 45% difference between the annualized return of the 14 year fixed indexed annuity and the S&P 500 index over a 1 year period beginning on January 1, 2008:
The next two slides display annualized returns for each of the fixed indexed annuities over the full time span:
- tom's blog
- Log in to post comments
Comments
Anonymous replied on Permalink
Babbel FIA Slides
In the last slide (46), how is the performance of a 9 year fixed indexed annuity measured over a span of 14 years? Is the 9 year annualized return simply applied to the 14 year period?
Dave Babbel replied on Permalink
No. The calculation is for
No. The calculation is for only nine years, or through 10/2008, whichever comes first. The way to read the chart is to consider the horizontal axis. The data point above 1995 shows the average rate of return over the ensuing 9 years, from 1/95 thru 12/2001. The data point above 1996 shows the average rate of return over the ensuing 9 years, from 1/96 thru 12/2002. etc.
Once the starting date gets to 1/2002, there are less than 9 years in our average. For example, the point above 2002 shows the average rate of return from 1/2002 thru 10/2008, almost 9 years. The point above 2003 shows the average rate of return from 1/2003 thru 10/2008, almost 8 years. And so forth.
Eugene Wittstock replied on Permalink
Tom, Thank you very much for
Tom,
Thank you very much for your research and in depth education of the widely misunderstood and criticized by the brokerage industry investment - fixed annuity.
Professor David Babel just proved what I have experienced in reality with my clients since 1999.
Good luck with your work.
Eugene
Anonymous replied on Permalink
2009 Data Points
The data for 2009 will be interesting.
Stephen Maersch replied on Permalink
Annuity study
The study is loaded and misleading.
It compares annuity returns with investment strategies that only a numbskull would use.
Try this: A 65-year-old male living in Wisconsin who invested $100,000 in an annuity would receive $626 a month ($7,512 a year) for life. If he started in 1995 and lived to age 79 he would have collected $105,168 on his annuity and when he died he would get nothing; the annuity company would get what was left of the principal.
Now let's see what would happen if this person instead placed his $100,000 in Vanguard's Wellesley Income fund. He would receive the same $7,512 a year as the annuitant -- but by age 79 he would have $141,246 in Wellesley to leave to his heirs.
Investors are constantly told to avoid high-commission, high-fee financial instruments.
If an annuity company can pay a salesperson a 5% commission for selling one of these things and then extract ongoing fees of 1.5% to run it you know it's a bad deal that can be creamed by an appropriate alternative investment.
Joan replied on Permalink
Annuity Study
What, exactly, is misleading and loaded about the study? You make no points in support of this comment.
You also do nothing to substantiate the annuity rate in your calculation. What type of annuity is this? Are these current rates or are they from 1995?
There are annuities that satisfy bequest motives. Were you using calculations for an immediate life annuity?
How are you calculating the Wellington return? The price of this fund on January 3, 1995 was $19.53 and the price the week or December 2008 was $23.83.
What marginal tax rate are you assuming for the Wellington fund interest/dividend yield and were those net return incorporated into your calculation?
How does the investor receive "the same $7,512 per year as the annuitant" when the funds are invested in the Wellington fund?
Are you saying that the total return on the Wellington fund is precisely the same as the return on the annuity rate that seems to have been picked out of thin air?
What guarantee does the Wellington fund provide? What if the person invested the week of September 17, 2007 when the fund price as around 35 and was forced to liquidate all or a portion of their assets in 2008 (a loss in excess of 35%)?
Anonymous replied on Permalink
Isn't it Ironic
I find it ironic that this type of completely unsubstantiated (and comic at times) criticism is in response to an academic study that so successfully exposed the unsubstantiated myths (equity indexed annuities are poor investments)that exist in the financial industry and media.
Anonymous replied on Permalink
Agreed on annuities
I would say that the quality of the analysis in the original comments by Stephen are at the complete opposite end of the spectrum compared to the analysis by Babbel--night and day.